SEDAC Population Density Estimates & Prevalence
Table of contents
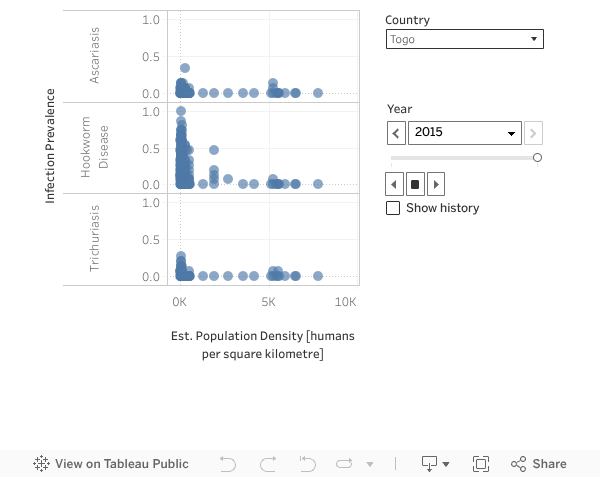
The graphs herein illustrate the relationships between the population density estimates, by the centre for Socioeconomic Data & Applications, and the prevalence of geohelminth disease types.
Population Density Estimates & Prevalence
Considering hookworm disease and Togo, the Togo graph suggests that hookworm disease prevalence decreases with increasing population. Perhaps because high population density areas tend to be towns/cities, and such areas tend to have much better sewage & water facilities, relative to rural areas. Why does hookworm disease standout? Probably because of the transmission dynamics of hookworm disease - infection/re-infection is via infective larvae that residing within unhygienic soil. [Within the manuscript, discuss Brooker 2006, Montresor 2011, amongst others.]