Missing Data Patterns Analysis
Table of contents
Null Regression
Most of the data's variables have missing values. Prior to deciding how to address missing values, it is important to understand the missing values patterns [@steyerberg2010]. Rubin [@rubin1976, @steyerberg2010, @little2019] outlines three fundamental missing data mechanisms
- Missing Completely at Random (MCAR): administrative errors, accident.
- Missing at Random (MAR): there’s an association between a variable’s missing data and available independent variables / outcomes.
- Missing Not at Random (MNAR): missing data associated with missing values of the factor/predictor in question or with unobserved predictors.
If the missing values of a data set in question are *missing completely at random* then complete case analysis will suffice because the complete case excerpt is akin to a random sample from a complete population. If MCAR does not hold, e.g., data is *missing at random*, then the complete case excerpt is not representative of the underlying population, therefore population inference is not possible via complete case analysis. [@steyerberg2010]
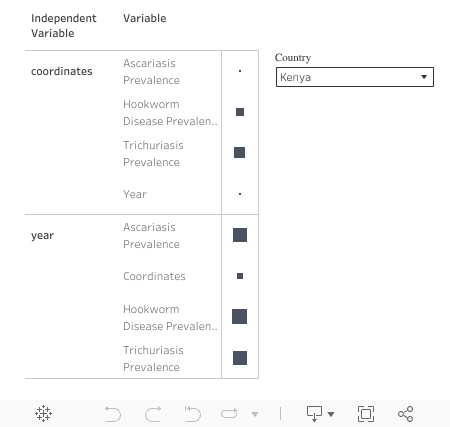
The null regression investigates whether the missing values of a reference, i.e., independent, variable are predictable. The hypotheses are
\(H_{0}\): The missing values of a reference/independent variable are not predictable via an outcome variable, or by other independent variables.
\(H_{1}\): It is quite probable that the missing values of a reference/independent variable are predictable via an outcome variable, or by other independent variables.
By the generalised linear model set-up
\[h(.) = \beta_{0} + \beta_{1}*(\textit{ascariasis prevalence}) + \beta_{2}*(\textit{trichuriasis prevalence}) + \ldots\]The null hypothesis should be rejected in favour of $H_{1}$ if the coefficient $\beta_{i}$ of a variable has a $p_{value} < 0.05$. Such a low $p_{value}$ implies that the missing values are not missing completely at random.
Within the null regression graphs below missing data analysis is applicable if, and only if, the independent variable has one or more missing values. Hover over a black square to view the $p_{value}$ w.r.t.with respect to the coefficient of a variable.
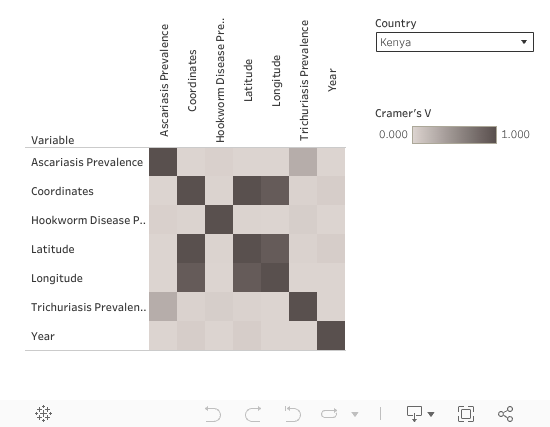
Null Correlation
The graphs below illustrate the degree of association/correlation between the missing cells of a pair of variables. A Cramer’s V value of 1 implies highly correlated; 0, the converse. Cramer’s V is inapplicable if neither variable has missing values.